Getting Started
Coverage Visualization
NOTE: This page contains information on standalone SoapUI Pro that has been replaced with ReadyAPI.
To try enhanced coverage functionality, feel free to download a ReadyAPI trial.
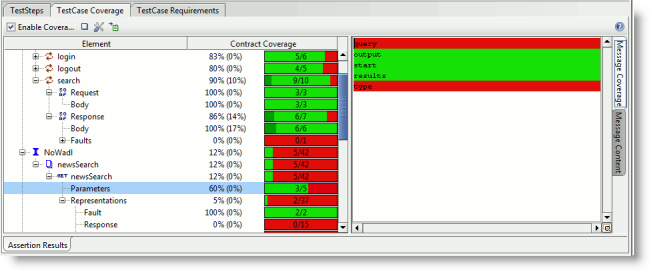
In all situations where Coverage can be calculated in soapUI, a Coverage Panel is available with the following basic layout:

- A toolbar at the top for enabling/clearing Coverage, setting Coverage Options and exporting a Coverage Report
- A Coverage TreeTable to the left containing the same items as the containing project together with calculated coverage percentage/color bar for the item.
- Two inspectors to the right containing either a Coverage Visualization for the selected operations request or response (“Message Coverage”) or the actual Message Content for the selected request or response in the tree.
- Optional Inspectors at the bottom, depending on measurement point:
- Run Log - Shows a log of the currently exectued tests
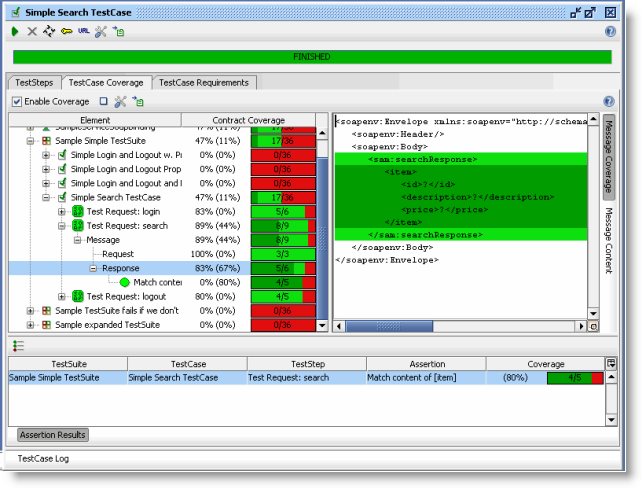
- Assertion Results : available when running Test Coverage; contains a table of the performed XPath Assertions during the tests. Select a TestSuite, TestCase or TestStep to narrow down the assertions, or select an assertion in the table to navigate to that TestStep assertion in the tree.
The Coverage Tree
The Coverage Tree displayed to the left is divided into 2 parts:

- The Interface Part displays the current projects REST Services and SOAP Interfaces with their respective children. For each SOAP operation the defined Request and Response header/body/faults/attachments messages are shown. The displayed Coverage values are aggregated “upwards” in the tree, for example in the image above, the search Operations’ Coverage is 8/9, which is the aggregate of the corresponding Request and Response message Coverage values. The values show that the Response Faults was not covered during the Test Run (0/1). For each REST method the defined Parameters and Representation body messages are shown.
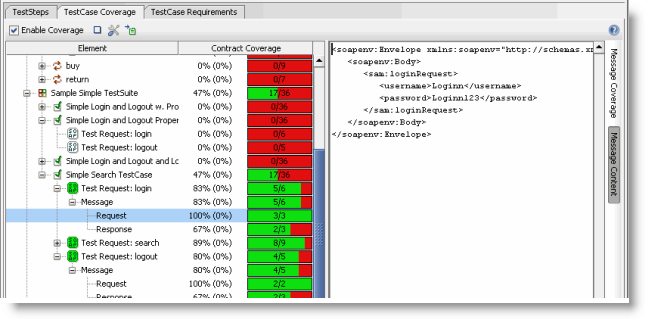
- The TestSuite part displays the current projects’ TestSuites, TestCases and relevant TestSteps. Under each TestStep that was the source of a Message Exchange during the Test Run, there will be Message nodes corresponding to the sent messages. Selecting a messages request or response node and then selecting the right Message Content inspector will show the actual content of the message (see image below). Selecting the Message Coverage inspector will instead show that messages’ coverage value.
Double click an item in the tree will try to open that items corresponding editor/viewer
Assertion Coverage
As mentioned above, when running functional Tests, all performed XPath assertions are analyzed and a coverage value measuring how large part of the Web Service contract that was actually asserted. Assertion Coverage is displayed in dark-green in both the Coverage Tree and the Message Inspector. In the image below, the Message Coverage Inspector shows that the item and contained values have been asserted by an XPath expression, the assertion can also been seen in the Assertion Results Inspector at the bottom.
